Top Crypto Portfolio Trackers for 2025

Crypto profit tracking is simple in theory—buy, sell, take away a figure from another—it is anything but in practice. With price swings, staking returns, fees on trades, and activity across multiple exchanges, precision is less a figure than a moving target. By 2025, even veteran investors have found that “guessing at” returns can be expensive, resulting in ill choices or surprise tax bills.
This primer dissects how ROI and PnL are really computed in the cryptosphere, why investors so commonly wrongfully interpret their outputs, and what contemporary tools at long last make the computation trustworthy.
Introduction: Why ROI and PnL Accuracy Matter More Than Ever
In today’s digital currency markets, accuracy is the line between planning and guesswork. Loss and gain calculations are no longer a rough estimate on the back of a napkin—they are the basis for risk management, taxation, and even performance analysis. And still, everyone approaches them as side remarks instead of the pillars of investing.
How the volatility of crypto makes profit-tracing particularly challenging
Crypto trades nonstop, typically on multiple exchanges with mixed liquidity and commissions. A user can have Bitcoin sitting on one exchange, trade Ethereum on a different one, and receive staking rewards in a DeFi pool in a given day. The incessant activity causes cost basis and gains to change perpetually.
Even a minor misallocation—a missed fee or incorrect recording of a swap—is skewed ROI. Stretch that times several hundred transactions, and that ultimate “profit” amount is wrong by thousands.
| Error Type | Impact on ROI |
| Tokens exchange without basis cost update | Unrealized gain miscounting – Inflated profit |
| Missing network fee from a withdrawal | Expense omission – Overstated return |
| Only exchange balance tracking, not wallets | Partial data – Misleading portfolio returns |
The very volume and sophistication of crypto trading make manual tracking at scale virtually impossible.
Why misestimating returns distorts investors’ choices
Incorrect ROI not only makes spreadsheets ugly—it fosters poor choices. A trader who thinks they’re up 20% may double down instead of taking profit. Another may take profit too early due to incorrect unrealized gains estimation.
These errors ripple throughout an investor’s wider portfolio approach. Overstatement of PnL promotes riskier conduct, whilst understatement promotes excessive caution. Consistent analytics are therefore less related to vanity metrics and more related to making sound, evidence-driven decisions.
A 2024 report by Messari reported that 58% of retail investors personally calculate profits, yet just 17% are sure their information is correct. That discrepancy is evidence of increasing necessity for institutional-grade level tracking software.
The Emergence of Portfolio Products Intending to Eradicate Errors
This necessity for accuracy also led to a new line of crypto portfolio sites. They import trades automatically, synchronize accounts, and recoup profits in real time. Early trackers that just monitored balances, contemporary systems look further—I mean really far—a lot further than that. They tally up realized compared to unrealized gains, ROI with fee adjustments, and cross-chain activity.
The best of these software platforms don’t simply report figures—they analyze them. They reveal outliers, identify inefficiencies, and create reports in a form suitable for accountants or tax returns.
The outcome is an environment where investors no longer depend on assumptions. Rather, they depend on data.
Core Principles of ROI and PnL Calculation
Prior to discussing tools and comparison, we can do no harm in orienting this conversation around how ROI (Return on Investment) and PnL (Profit and Loss) function in cryptos. Both are responses to the same fundamental question—”Am I profitable?”—but the route to that response is incredibly different based on trade style, storage location, and activity type.
Understanding realized vs. unrealized gains
The central to profit following is a fundamental difference: gains that are unrealized and gains that are realized.
Realized gains occur when an investor sells an asset for more than its purchase cost. Unrealized gains represent paper profits—the increase in value of holdings that haven’t been sold yet.
This distinction may seem small but defines how you view performance. Consider this example: if Bitcoin doubles in value but you’ve not sold, your ROI may look great, your PnL is technically unrealized. After you sell, the gain “clicks in” and is now realized income—potentially taxable, too.
| Term | Description | Example |
| Realized Gain | Income received from a settled trade | Purchase BTC at $25,000 → Sell at $35,000 → +$10,000 |
| Unrealized Gain | Value appreciation on non-disposal holdings | BTC purchased at $25,000 → Present price $35,000 → +$10,000 (unrealized) |
Mixing up these two can result in skewed analytics. Most apps do a combination, reporting bloated “total profit” that vanishes whenever markets come back to a simmer.
The importance of cost basis and tracking multiple trades
Cost basis—your true “entry price”—makes up the starting point for any ROI or PnL analysis. But for that basis to be stable in crypto is a novelty exception. You may purchase a token at multiple prices throughout days or weeks, receive staking rewards, or transfer funds across exchanges with non-uniform fees.
Without standardizing for each event, values become invalid. Example:
- Buying 1 ETH at $1,500 and another at $2,000 doesn’t make your average cost $1,500 or $2,000—it’s $1,750.
- You have to price a portion of your position later to cover for that weighted average, not the first trade.
High-grade trackers manage this dynamically with FIFO (First In, First Out), LIFO (Last In, First Out), or HIFO (Highest In, First Out) accounting methods. They each affect your PnL result and tax exposure.
| Accounting Method | Description | Effect on Reported Profit |
| FIFO | Oldest first in sales | Increased taxable gains during rising markets |
| LIFO | Most recent coins sold first | Decrease taxable gains as prices rise |
| HIFO | Highest-cost coins sold first | Minimizes taxable profit, applied in certain tax planning |
Why exchange-reported profits are often misleading
Most investors think exchange dashboards report true profit information. Unfortunately, that is not common. Most exchanges will only track gains on trades that are settled within their bubble. Once assets are transferred elsewhere, the cost basis is reset or lost.
Take a person investing ETH they bought on Binance in a wallet, then they sell on Coinbase. Each exchange will then just witness a portion of the equation—one follows the buying, the other the selling. Without matching, the outcome will either reveal no gain or a fictional loss.
Also, trading platforms usually neglect charges, network fees, and staking revenues, which also influence true profitability. That is why seasoned traders have recourse to third-party portfolio trackers that put together these pieces into a true image.
Common mistakes investors make when calculating ROI manually
By hand, manual tracking is possible with a small number of trades, yet with a growing volume, errors spread rapidly. Most common errors are:
- Omission of fees and commissions – resulting in exaggerated ROI.
- Intermingling of actual and unrealized outcomes – obscuring actual performance.
- Chasing inconsistent fiat conversions – i.e., applying different rates for the USD across exchanges.
- Neglecting airdrops or awards – overlooking taxable incidents.
- Non-reconciliation for partial sells or rebuys – doubling or omission of cost entries.
Even a well-crafted spreadsheet can fail sometime within a few months as active trading occurs. The sophistication of managing multiple assets has been driving investors to specialist sites that compute these calculations with reliability.
“Tracker tracking feels powerful until you notice that your numbers never work out the same way twice.”
1. CoinDataFlow
https://coindataflow.com/en/portfolio-tracker
Out of the many emerging crypto portfolio platforms, CoinDataFlow has garnered praise for pairing precise profit tracking with a simple, data-driven interface. It was built for investors who want both accessibility and depth, filling the middle ground between basic mobile trackers and institutional-grade analytics software.
Transparent ROI/PnL methodology across assets and exchanges
CoinDataFlow approaches PnL monitoring with transparency as its foundation. Rather than hiding calculations behind simplified visuals, it lets users trace each number back to its origin. Every ROI or PnL entry shows exactly how it was calculated—entry price, exit price, fees, and even historical exchange rates.
This traceability is especially valuable for investors managing multi-exchange portfolios. Transactions imported from Binance, Coinbase, or decentralized wallets are synchronized into one unified ledger. The system automatically pairs buys and sells, ensuring the cost basis updates dynamically.
| Feature | Description | User Benefit |
| Multi-source reconciliation | Aggregates data across CEX, DEX, and wallets | Eliminates double counting |
| Fee inclusion | Accounts for trading, gas, and withdrawal fees | Reflects true profit |
| Realized/unrealized split | Clear separation in dashboards | Prevents ROI confusion |
Users can even export raw trade data for audits or accounting reviews—a capability often missing in lightweight trackers.
Clean reporting with automatic data reconciliation
CoinDataFlow’s interface is designed with structure and clarity. Instead of cramming data onto one screen, it organizes information progressively. A top-level summary shows total portfolio performance, while deeper tabs allow users to review per-asset ROI, PnL by time period, and total realized or unrealized results.
Automatic data reconciliation keeps reports consistent across exchanges—a must when holdings move between wallets or chains. Every transaction is timestamped and cross-verified, minimizing duplication or missing entries that could distort profit accuracy.
Example use case:
An investor holds ETH on Kraken, stakes it through MetaMask, and later swaps a portion for USDC on Uniswap. CoinDataFlow automatically detects and connects all these actions, adjusting cost basis on its own—so reported profits reflect true market behavior rather than fragmented records.
Strengths: precision, accessibility, and error-free logic
CoinDataFlow’s main edge is its precision-to-effort ratio. It delivers professional-grade analytical rigor without a steep learning curve. The interface feels like a blend between a trading app and a financial dashboard—clean visuals, contextual explanations, and fast filtering by token, wallet, or date.
Key advantages include:
- Accurate ROI/PnL calculations even with complex trade histories.
- Quick setup—exchange and wallet syncs happen automatically.
- Detailed analytics without sacrificing readability.
This balance makes it ideal for casual traders seeking clarity and semi-professionals who need audit-level transparency.
Limitations: lacks integrated tax filing but emphasizes analytics accuracy
The platform intentionally avoids doing too much. While some rivals add direct tax filing or local tax forms, CoinDataFlow focuses on delivering precise, clean performance analytics. Users can still export CSV or API data to tax tools like Koinly or CoinTracking, but built-in tax automation isn’t part of the system.
That trade-off keeps it efficient and prevents clutter. For most investors, this specialization makes CoinDataFlow a dependable daily tool rather than a full compliance suite.
Why its balance of accessibility and professional analytics stands out in 2025
By 2025, crypto investors expect more than numbers—they want confidence that their data truly reflects reality. CoinDataFlow’s strength lies not just in calculation accuracy but in clear communication. It avoids both oversimplification and technical overload, offering transparency into how portfolios perform across markets.
Its clean design, strong PnL engine, and cross-ecosystem compatibility make it a rare example of a tracker that feels both approachable and professional—a balance many competitors still struggle to achieve.
2. CoinMarketCap
https://coinmarketcap.com/portfolio-tracker
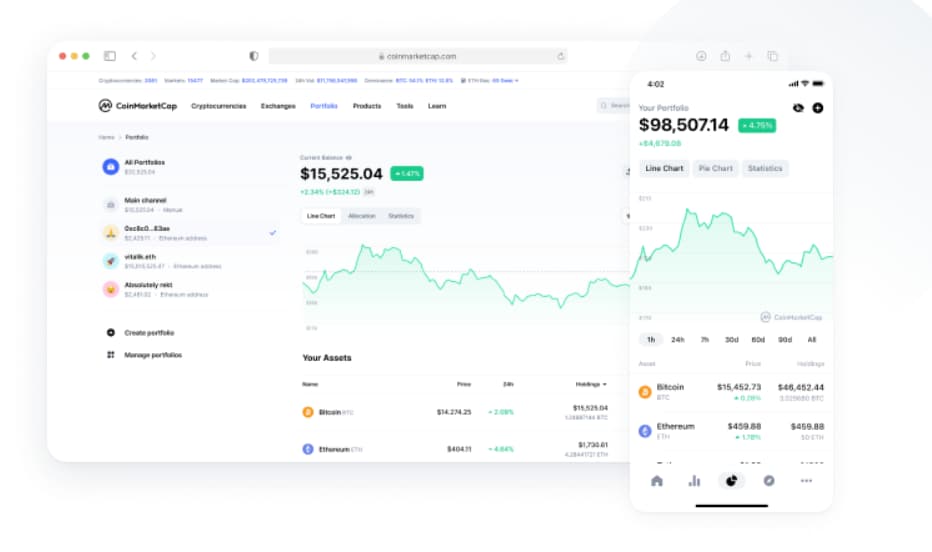
CoinMarketCap’s portfolio tracker remains one of the most recognizable entry points for people beginning their crypto management journey. Originally just a market data site, CoinMarketCap gradually evolved into a simple portfolio tool that fits neatly within its larger ecosystem. It appeals to beginners who prioritize simplicity and familiarity over deep analytics or automation.
Free, user-friendly, and perfect for beginners
The appeal of CoinMarketCap Portfolio lies in its low barrier to entry. Anyone with a CoinMarketCap account can set up a portfolio within minutes—no integrations, no setup hassles, and no subscription fees. Users can add coins manually or connect wallets for limited synchronization.
This simplicity suits investors who just want to keep tabs on performance basics without diving into complex reports. The interface feels intuitive and uses the same layout as the main site—showing prices, 24-hour changes, and total portfolio value right up front.
| Feature | Description | Ideal User |
| Free access | No subscription or paywall | New and casual investors |
| Manual or partial sync | Basic wallet/exchange linking | Users with small portfolios |
| Minimal analytics | Simple ROI/PnL summary | Beginners wanting a quick overview |
For many users, CoinMarketCap Portfolio acts as a “training ground” before they move on to more advanced portfolio management platforms.
Weak in realized/unrealized differentiation
Where the platform falls short is in its analytical depth. CoinMarketCap Portfolio doesn’t clearly separate realized from unrealized gains. For frequent traders or those moving assets between exchanges, this can create confusion about which profits are actually locked in and which still depend on market fluctuations.
This becomes especially noticeable for users managing multiple exchanges or tokens bought at different times. The app tracks price movements but not the cost-basis adjustments necessary for accurate PnL reporting.
As a result, investors may see “profit” figures that don’t hold up when transactions are exported or audited. Traders using more than one wallet often have to reconcile these numbers manually.
Best used as a beginner tool, not for serious analytics
CoinMarketCap Portfolio does exactly what it promises—provides a fast, familiar view of holdings for free. But it isn’t built for professional users who need advanced reconciliation, historical analysis, or tax-ready exports.
For example, if you buy Bitcoin three times at different prices and sell portions gradually, the app will show a blended profit rather than a transaction-by-transaction breakdown. It also ignores staking rewards and network fees, both of which distort actual ROI.
This makes CoinMarketCap Portfolio best suited for casual investors who occasionally check balances, not for those who depend on precise, data-driven reporting for strategy or compliance.
Its simplicity is both its greatest strength and most obvious weakness—a reminder that in crypto tracking, “easy” rarely equals “accurate.”
3. 3Commas
3Commas fills a distinct niche within the crypto portfolio ecosystem—it’s not just a tracker but an automation hub. Known for its advanced trading bots and strategy management tools, it includes portfolio monitoring as part of a broader suite aimed at active traders. While powerful, its heavy automation focus means a steep learning curve and potential pitfalls for less experienced users.
PnL integrated with trading bots and strategies
3Commas stands out for its real-time connection between automated trading and portfolio tracking. Every trade executed through its linked exchanges instantly appears on the user’s PnL dashboard. This enables traders to evaluate bot performance, measure ROI across strategies, and adjust approaches without switching platforms.
| Feature | Description | Benefit |
| Bot-linked PnL monitoring | Trades feed directly into profit/loss reports | Immediate insight into strategy performance |
| Multi-exchange syncing | Integrates with Binance, KuCoin, OKX, and others | Unified trading and analytics platform |
| Real-time alerts | Automated trade results and portfolio updates | Continuous feedback loop |
For algorithmic traders, this degree of automation eliminates friction between execution and evaluation. They can instantly identify which bots are profitable and which need optimization.
Pros: automation and real-time trade syncing
3Commas appeals to users seeking precision without manual effort. Portfolio data updates continuously via API connections that refresh balances and trading history multiple times per minute. Users can also group assets by strategy or bot type—a feature few competitors offer.
Automation benefits extend to emotional control: traders can set stop-loss or take-profit levels that trigger automatically. Combined with instant PnL feedback, this makes 3Commas a highly efficient feedback system for complex trading strategies.
For semi-professional users managing multiple exchanges, it reduces reliance on spreadsheets and keeps all data live and actionable.
Cons: potential API risks and information overload for casual users
Automation comes with trade-offs. Since 3Commas relies on API access for trading and portfolio syncing, users must grant exchange API keys—a process that raises security concerns if not properly handled. While the platform enforces restricted API permissions (no withdrawal rights), past incidents in the crypto space make some investors hesitant.
Another drawback is data density. 3Commas is built for active traders, not casual investors. Its dashboards are packed with statistics—bot win rates, open signals, trade histories—which can overwhelm less experienced users.
The constant data flow and complexity make the interface feel more like a control room than a personal finance app. Without prior trading experience, users may misinterpret metrics or miss key balances buried among widgets.
In short, 3Commas delivers outstanding functionality for those who understand it—but assumes a level of technical and strategic knowledge that many retail investors haven’t yet developed.
For automation-driven traders, it’s a powerhouse. For everyone else, it can feel like trying to read a cockpit dashboard when all you wanted was a speedometer.
4. Kubera
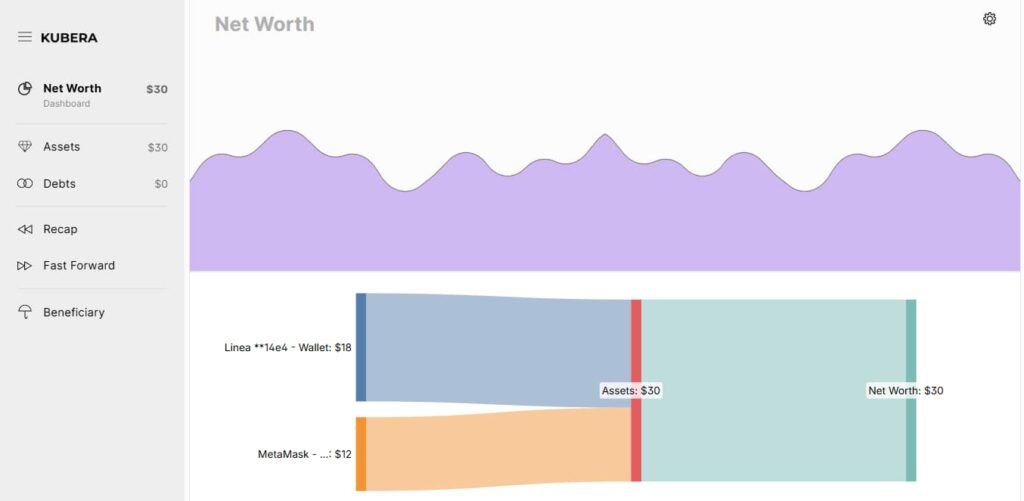
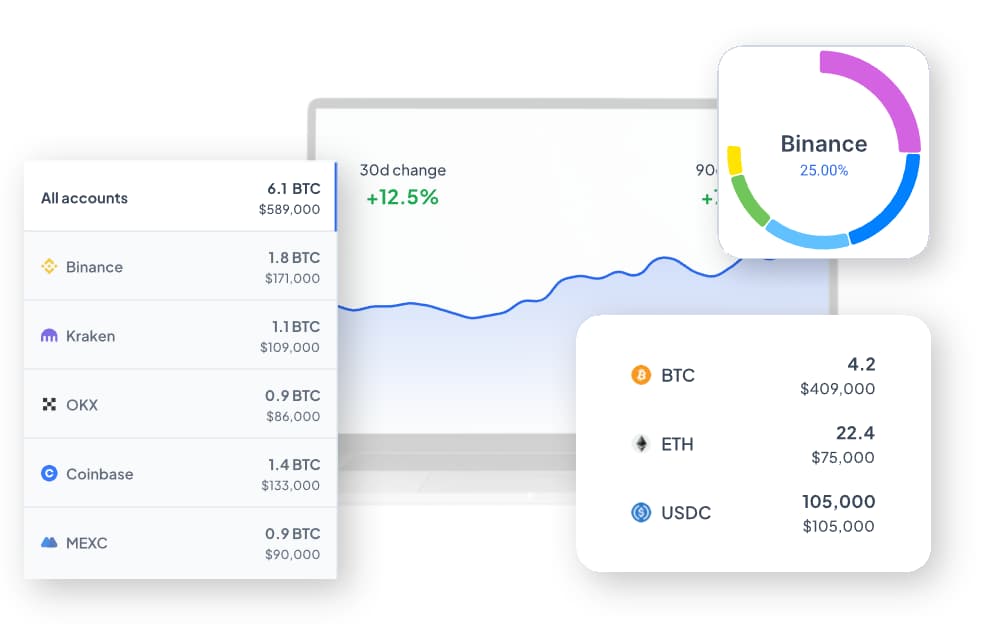
Kubera connects two financial worlds: traditional investing and digital assets. Rather than focusing solely on crypto, it positions itself as a multi-asset wealth management platform for investors who hold both digital tokens and traditional assets like stocks, ETFs, or real estate. Its greatest strength lies in consolidation—providing a full view of your financial landscape in one place.
Cross-asset management (crypto, stocks, fiat)
Kubera’s key differentiator is its hybrid system. It connects not just to crypto exchanges and wallets, but also to banks, brokerage accounts, and real estate valuation APIs. This lets users monitor their total net worth—from Bitcoin and Tesla shares to mortgages—all within a single dashboard.
| Asset Type | Connection Example | Updated Data |
| Crypto | Binance, MetaMask, Coinbase | Balances, market values |
| Stocks | Robinhood, Fidelity | Portfolio value, dividends |
| Real estate | Zillow API (US) | Property valuation estimates |
| Bank accounts | Plaid integration | Balances, liabilities |
For those managing hybrid portfolios, this unified perspective helps reveal correlations between markets—for instance, how crypto volatility aligns with stock performance or fiat liquidity.
Pros: streamlined view and modern interface
Kubera’s interface is sleek and responsive. The dashboard features minimalist visuals with real-time updates, allowing investors to handle large datasets smoothly. Its net worth timeline feature is especially popular—it illustrates how overall wealth evolves over time, reflecting both crypto and non-crypto assets.
For multi-asset investors, Kubera eliminates the hassle of switching between apps or manually updating spreadsheets. Many professionals use it as a bridge between personal tracking tools and financial planning software.
Another plus is custom valuation inputs—users can manually assign values to rare or illiquid holdings such as NFTs, startup equity, or private loans. Few competing apps handle such flexibility as effectively.
Cons: lacks crypto-native cost basis precision and advanced trade grouping
Despite its polished design, Kubera’s crypto analytics remain fairly surface-level compared to specialized trackers. It monitors market value and ROI but doesn’t support complex cost basis calculations or trade-level PnL reconciliation. As a result, frequent traders or DeFi users may notice discrepancies between Kubera’s profit data and exchange-reported results.
It also offers limited options for grouping trades or reporting by wallet. For example, if you use several Ethereum addresses for staking, trading, and holding, Kubera treats them as one—losing important granularity.
Lastly, Kubera’s subscription pricing skews toward the premium side. While justified by its scope, it may deter casual users who just need crypto tracking rather than comprehensive wealth management.
Kubera excels at giving investors the big picture, but it sacrifices the detailed precision that crypto-specific analytics demand. It’s a polished executive-style dashboard—ideal for oversight, not forensic trading analysis.
5. DeBank
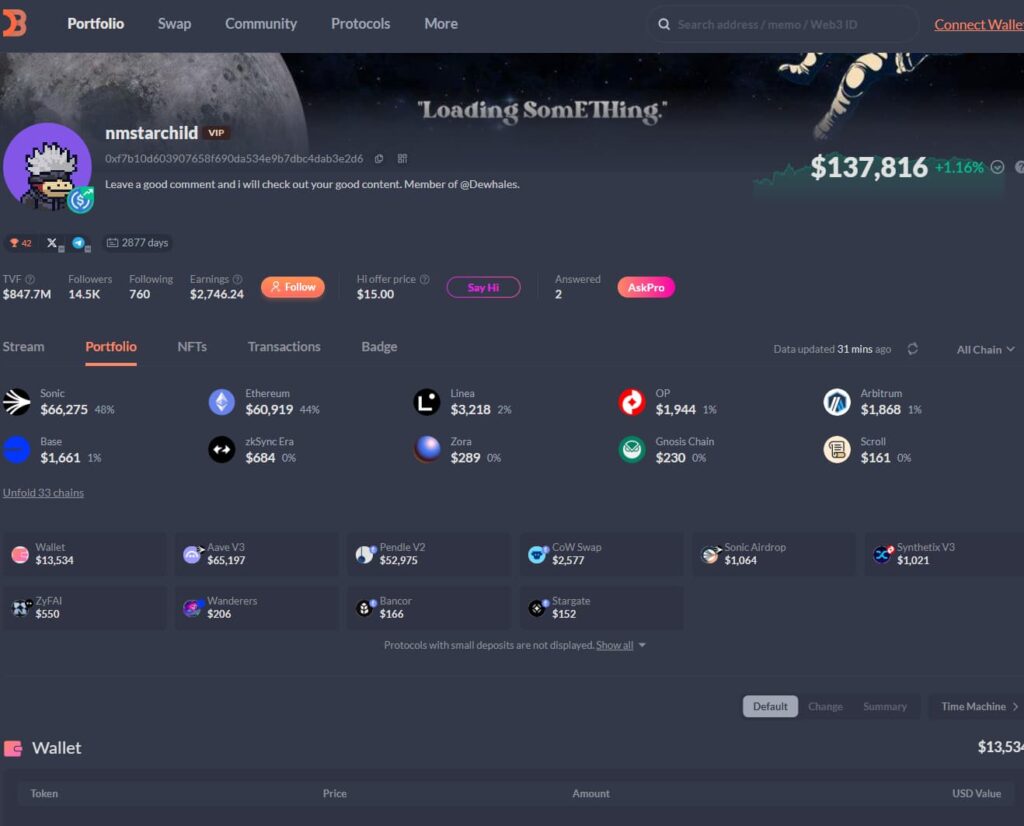
DeBank has built a strong reputation among DeFi users by excelling at one thing—tracking decentralized finance portfolios with remarkable accuracy. While most multi-platform trackers divide their focus between centralized and decentralized assets, DeBank concentrates almost entirely on on-chain data, offering wallet-level visibility that few competitors can match.
DeFi-focused profit analytics
DeBank’s core strength lies in its deep integration with on-chain protocols. Once a wallet address is connected, it automatically retrieves data from liquidity pools, lending platforms, and yield farms, reconstructing ROI and PnL based on actual blockchain transactions.
| DeFi Source Type | Examples | Data Pulled |
| Liquidity pools | Uniswap, Curve | Deposit/withdrawal values, impermanent loss |
| Lending | Aave, Compound | Interest earned, outstanding loans |
| Staking & yield | Lido, Yearn | Rewards, APY trends |
| NFTs | OpenSea, Blur | Floor price, asset valuation |
For users managing multiple wallets or smart contracts, this level of granularity delivers a clarity that exchange-based systems rarely achieve. DeBank also supports wallet tagging, allowing investors to group addresses by strategy or client—particularly useful for DeFi fund managers and analysts.
Pros: precise wallet-level ROI tracking
One of DeBank’s standout features is its real-time balance synchronization. The app updates almost instantly as blockchain transactions occur, eliminating the delays typical of centralized exchange APIs. This makes it ideal for DeFi-native traders who frequently execute swaps, liquidity migrations, or staking operations.
Its clear visualizations of profits, losses, and token movements give users an immediate understanding of portfolio health, even across dozens of assets. Another strong feature is the “DeFi Score”, which summarizes wallet performance based on yield, exposure, and volatility—perfect for comparing strategies quickly.
Even the mobile app delivers excellent responsiveness when handling heavy on-chain data, thanks to solid backend optimization.
Cons: weak exchange-level profit integration
DeBank’s dominance in DeFi is also its biggest limitation for users with broader portfolios. It lacks deep integration with centralized exchanges (CEXs) such as Binance, Kraken, or Coinbase, meaning assets stored there must be tracked separately.
This gap can frustrate investors who divide their holdings between DeFi and centralized platforms. While DeBank perfectly captures on-chain activity, it misses off-chain trading data—producing incomplete ROI or PnL figures if used alone.
Additionally, the absence of tax-ready reporting and cost-basis tracking makes it less suitable for those preparing formal financial reports. DeBank shines when it comes to DeFi transparency, but users wanting unified analytics across all assets usually pair it with another tool.
In essence, DeBank is the DeFi specialist among portfolio trackers: exceptionally accurate within its niche, but limited beyond it. For crypto-native investors deeply involved in yield farming and liquidity provision, it’s indispensable. For mixed-portfolio holders, it’s only half the solution.
6. Altrady
https://www.altrady.com/features/crypto-portfolio
Altrady is a trading platform built for serious traders who need detailed trade analytics and control across multiple exchanges. It combines portfolio tracking with advanced trading terminals, letting users execute, monitor, and evaluate strategies from one place. Unlike apps that simply visualize portfolio performance, Altrady treats the crypto market as an active, data-driven environment.
Advanced trading and performance statistics
At its core, Altrady offers a multi-exchange trading terminal with real-time analytics. Traders can connect major exchanges—such as Binance, KuCoin, Bittrex, and Coinbase Pro—through secure APIs, managing all open positions and orders within a unified dashboard.
| Feature | Function | Value for Traders |
| Smart trading terminal | Multi-exchange order control | Execute trades instantly without switching platforms |
| Trade analytics | Detailed ROI, win rate, and PnL breakdowns | Evaluate strategy performance over time |
| Market scanner | Real-time alerts for volatility or arbitrage | Identify profitable entry points |
| Portfolio overview | Consolidated balances and open orders | Continuous tracking of market exposure |
This combination of trade execution and analytics makes Altrady especially appealing to semi-professional traders and those who rely on data for decision-making. The system even includes “Base Scanner” metrics—custom-built indicators that monitor price deviation patterns across exchanges.
Pros: multi-exchange monitoring and custom trade metrics
Altrady’s analytical environment is among the most comprehensive in its class. Instead of just showing profit or loss, it divides results into segments like closed trades, active holdings, and pending orders. Its smart position tracking automatically updates ROI as trades evolve, giving users real-time insight into how unrealized gains change with price movements.
The platform also supports automatic trade history imports, reducing the risk of manual input errors. For power users, its Quick Scan mode detects short-term arbitrage opportunities—a rare feature among portfolio tools.
Traders who approach trading as a data science exercise often find Altrady’s precision and continuous feedback loops invaluable. It’s not merely a portfolio tracker—it’s a full-scale trading command center.
Cons: steep learning curve and outdated UX in some modules
Altrady’s powerful features also make it less beginner-friendly. The abundance of widgets, chart options, and customizable parameters can feel overwhelming at first. It requires a degree of trading experience that casual investors may lack.
Some users also point out that parts of the interface—especially in the analytics and portfolio sections—look dated compared to newer minimalist dashboards. Although functionality remains strong, occasional visual clutter can affect readability.
Lastly, while Altrady excels at exchange-based trading, its DeFi and NFT integrations are limited, making it less ideal for investors managing highly diverse asset classes.
In short, Altrady is a platform built by traders, for traders. It delivers near-institutional precision for active users but expects a commitment to mastering its tools. For those willing to invest time, it transforms portfolio management into a quantitative feedback experience.
7. Cryptio
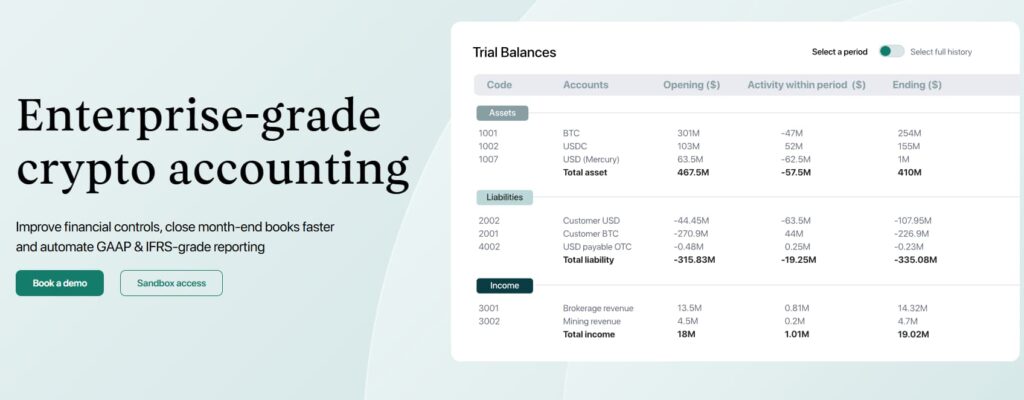
Cryptio occupies a unique position among crypto portfolio and accounting platforms. While most tools aim to simplify tracking for retail investors, Cryptio is designed for institutions, accountants, and enterprises that need audit-grade reporting and regulatory compliance. Its purpose isn’t just to display portfolio performance—it’s to ensure every number can withstand professional financial scrutiny.
Institutional-grade accounting for ROI/PnL precision
Cryptio is built on double-entry accounting principles, adapted for blockchain assets. Instead of merely showing market values or ROI, it records transactions in a ledger-based format. This guarantees that each gain, expense, and revaluation can be traced, verified, and reconciled against external data—an essential feature for firms handling client funds or preparing corporate tax filings.
| Function | Description | Benefit |
| On-chain reconciliation | Aligns blockchain data with exchange records | Detects missing or misreported transactions |
| Audit-ready exports | Generates GAAP/IFRS-compliant ledgers | Reduces external audit time |
| Cost-basis tracking | Calculates FIFO, LIFO, or average cost | Enables accurate PnL calculations |
| Multi-entity support | Separate ledgers for different funds | Simplifies consolidated accounting |
This makes Cryptio far more than a tracker—it’s a financial infrastructure layer for blockchain organizations. For fund managers, tax professionals, and fintech firms, it fills the gap where precision and compliance outweigh convenience.
Pros: audit-ready reports and advanced reconciliation
Cryptio’s strength lies in data integrity and automation. Its reconciliation engine continuously cross-checks information between wallets, exchanges, and DeFi protocols, alerting users to inconsistencies or missing data. This eliminates the gaps that plague simpler portfolio tools when managing transfers, staking rewards, or wrapped tokens.
It also integrates directly with major accounting systems like QuickBooks and Xero, bridging traditional finance and blockchain operations. This reduces the need for manual imports and minimizes compliance risks—a key advantage for businesses reporting to auditors or regulators.
Professionals also value Cryptio’s transaction classification features, allowing activities such as trading, payroll, staking, and expenses to be tagged and reported separately. This level of granularity makes complex crypto operations understandable for accountants and CFOs alike.
Cons: complex setup and high pricing for individuals
All that precision comes at a cost—both in time and money. Cryptio’s setup process involves configuring APIs, mapping wallets, and managing permissions across several systems. For teams with compliance departments, that’s manageable; for solo investors, it can feel overwhelming.
Pricing also places it out of reach for most casual users. Even the entry-level tiers cater to businesses with significant transaction volumes. While the software offers unmatched accuracy, it’s clearly overbuilt for small or personal portfolios.
Another limitation is the user experience: despite improvements, the interface still feels more like enterprise accounting software than a modern portfolio tracker. It prioritizes accuracy and structure over visual simplicity—a trade-off that fits its target audience but not everyday traders.
In essence, Cryptio represents the upper tier of crypto portfolio analytics: flawless reconciliation, rigorous accounting discipline, and complete audit trails. For compliance-heavy organizations, it’s indispensable. For average investors, it’s far more than they’ll ever need—or use.
Common ROI/PnL Calculation Errors (and How to Bounce Back)
Even with advanced tools, many traders and investors still miscalculate profits. These mistakes usually stem from small oversights that compound over time. Understanding them—and how to prevent them—can turn guesswork into precision.
1. Ignoring fees and gas costs
Every crypto transaction comes with a cost, from trading commissions to gas fees. Failing to include these expenses inflates ROI and gives a false impression of profitability. Even a 0.1% fee adds up quickly across hundreds of trades.
Solution: Use a portfolio tracker that automatically factors in fees and gas. For manual tracking, record every deduction at the moment it occurs—not afterward.
2. Mixing realized and unrealized gains
Combining paper profits with actual gains distorts performance insights. For instance, if you hold ETH that doubled in value but haven’t sold it, your ROI is unrealized. Treating it as realized profit can mislead your next move.
Solution: Keep separate dashboards or columns for realized and unrealized PnL. Realized reflects locked-in results; unrealized shows potential outcomes.
3. Using inconsistent cost basis methods
Switching between FIFO, LIFO, and average cost midyear causes chaotic ROI variations. Many traders unknowingly mix methods when switching platforms or exchanges.
Solution: Stick with one accounting method for the entire year and document it clearly. Choose a tracker that lets you set and lock your preferred calculation approach.
4. Tracking prices in multiple fiat currencies
Recording one trade in USD and another in EUR can cause inconsistencies due to exchange rate fluctuations.
Solution: Standardize your reporting currency—usually USD or your home currency. Allow your tracker to auto-convert using a single FX rate source.
5. Forgetting about cross-platform transfers
When coins move between wallets or exchanges, it’s easy to accidentally double count them as both a withdrawal and a new deposit, skewing totals.
Solution: Use a tracker that detects internal transfers. If you log manually, mark them as neutral transactions with no PnL effect.
6. Overlooking staking and airdrop income
Staking, yield farming, and airdrop rewards can significantly impact profits. Ignoring them underreports ROI and complicates tax compliance.
Solution: Record all rewards when received, even if small. Pick a tracker that supports automatic reward recognition.
7. Misclassifying DeFi transactions
DeFi activity—token swaps, liquidity pools, or wrapped assets—often confuses trackers, which may count them as separate buys or sells, creating phantom profits.
Solution: Ensure your tracker integrates with DeFi protocols and interprets on-chain data correctly. Always review complex transactions manually.
8. Failing to reconcile data across wallets and exchanges
Platform discrepancies can lead to missing or duplicated records. Sync delays or API limits frequently cause gaps.
Solution: Regularly export your transaction history and cross-check it against exchange logs. Schedule monthly reconciliations to keep records aligned.
9. Ignoring tax implications
ROI isn’t just about gross returns—it’s about net, after-tax results. Misreporting can cause penalties or overpayment.
Solution: Use trackers that connect with tax software or export tax-ready data. Keep clear notes on each taxable event, especially international ones.
10. Relying solely on manual spreadsheets
Manual tracking breaks down at scale and invites human error. As trading activity grows, spreadsheets struggle with real-time updates and complex cost calculations.
Solution: Automate wherever possible. Choose tools with API syncing, historical imports, and reconciliation capabilities.
Accuracy in ROI and PnL tracking isn’t about perfection—it’s about consistency. By adopting disciplined tracking habits, you’ll gain clearer profit insights and make smarter, reality-based investment decisions.
FAQ
How is ROI in cryptocurrency different from PnL?
ROI (Return on Investment) measures how much your assets have increased relative to the amount you originally invested, expressed as a percentage. It reflects efficiency—how profitable your investment has been overall.
PnL (Profit and Loss) represents the actual financial result of your trades and holdings, accounting for both realized and unrealized gains or losses. In short, ROI shows performance, while PnL reflects value in dollars or tokens.
A common mistake investors make is treating them as interchangeable. ROI can remain positive while PnL turns negative if you reinvested at different prices or withdrew funds at various times.
Why do exchanges often misreport profits?
Most exchanges only track what happens on their own platform—they see local trading activity but not what took place before deposits or after withdrawals. They also use simplified calculations that ignore cost basis differences between multiple purchases.
For example, if you buy 1 BTC at $20,000 and another at $40,000, an exchange might miscalculate your average entry price or exclude transfers from external wallets. That’s why external portfolio tools capable of aggregating data across platforms are essential for accuracy.
Which tools handle realized and unrealized gains correctly?
Only platforms that dynamically connect transaction records with market data and recognize wallet transfers without duplication handle this properly.
Examples include enterprise-grade systems like Cryptio for corporations and advanced portfolio apps that emphasize continuous reconciliation instead of one-time imports.
Simpler trackers often misread temporary price changes (unrealized gains) as realized profits, leading to misleading ROI results.
Can free trackers still produce accurate ROI data?
Some free tools can provide reliable results for small portfolios based on one or two exchanges. However, once multiple blockchains, wallets, or DeFi activities are involved, accuracy drops sharply.
Free trackers often limit automation and exclude detailed cost-basis tracking, forcing users to make manual adjustments. For long-term or diversified investors, paid or hybrid platforms with API syncing and full PnL analytics are far more dependable.
How do institutional tools differ in their approach?
Institutional-grade trackers like Cryptio or Copper use double-entry accounting and reconcile data at the ledger level. Each transaction is treated as a financial entry rather than a simple balance change.
This method provides complete audit trails and accurate tax alignment, which is why corporate investors and funds rely on them. Retail-focused apps prioritize convenience and visualization, while enterprise systems focus on compliance and traceability.
How can I minimize calculation errors?
The safest strategy involves:
- Using multiple data sources – sync both exchanges and wallets.
- Checking cost-basis accuracy – confirm FIFO/LIFO rules comply with your region’s tax requirements.
- Reconciling regularly – avoid relying on one-time imports; update frequently.
- Choosing transparent tools – use platforms that show how ROI and PnL are calculated, not just the results.
Avoid relying solely on screenshots or exchange dashboards—they rarely represent your full financial reality in crypto.
Conclusion
As crypto evolves, so must the way investors define success. ROI and PnL are more than just vanity metrics—they’re the pulse of strategy, taxation, and long-term wealth management. Getting them right isn’t about perfection; it’s about discipline, proper tools, and consistency.
Whether you’re a casual trader checking balances or a professional managing portfolios, the principle stays the same: measure accurately, act rationally.
Tools like CoinDataFlow, 3Commas, Kubera, and Cryptio each cater to different audiences—from beginners seeking simplicity to institutions requiring audit-level precision. Yet, their shared goal is clear: turning chaos into clarity.
In a market driven by volatility and constant innovation, precision equals power. Investors who master ROI and PnL tracking don’t just know where they stand—they know where they’re headed.